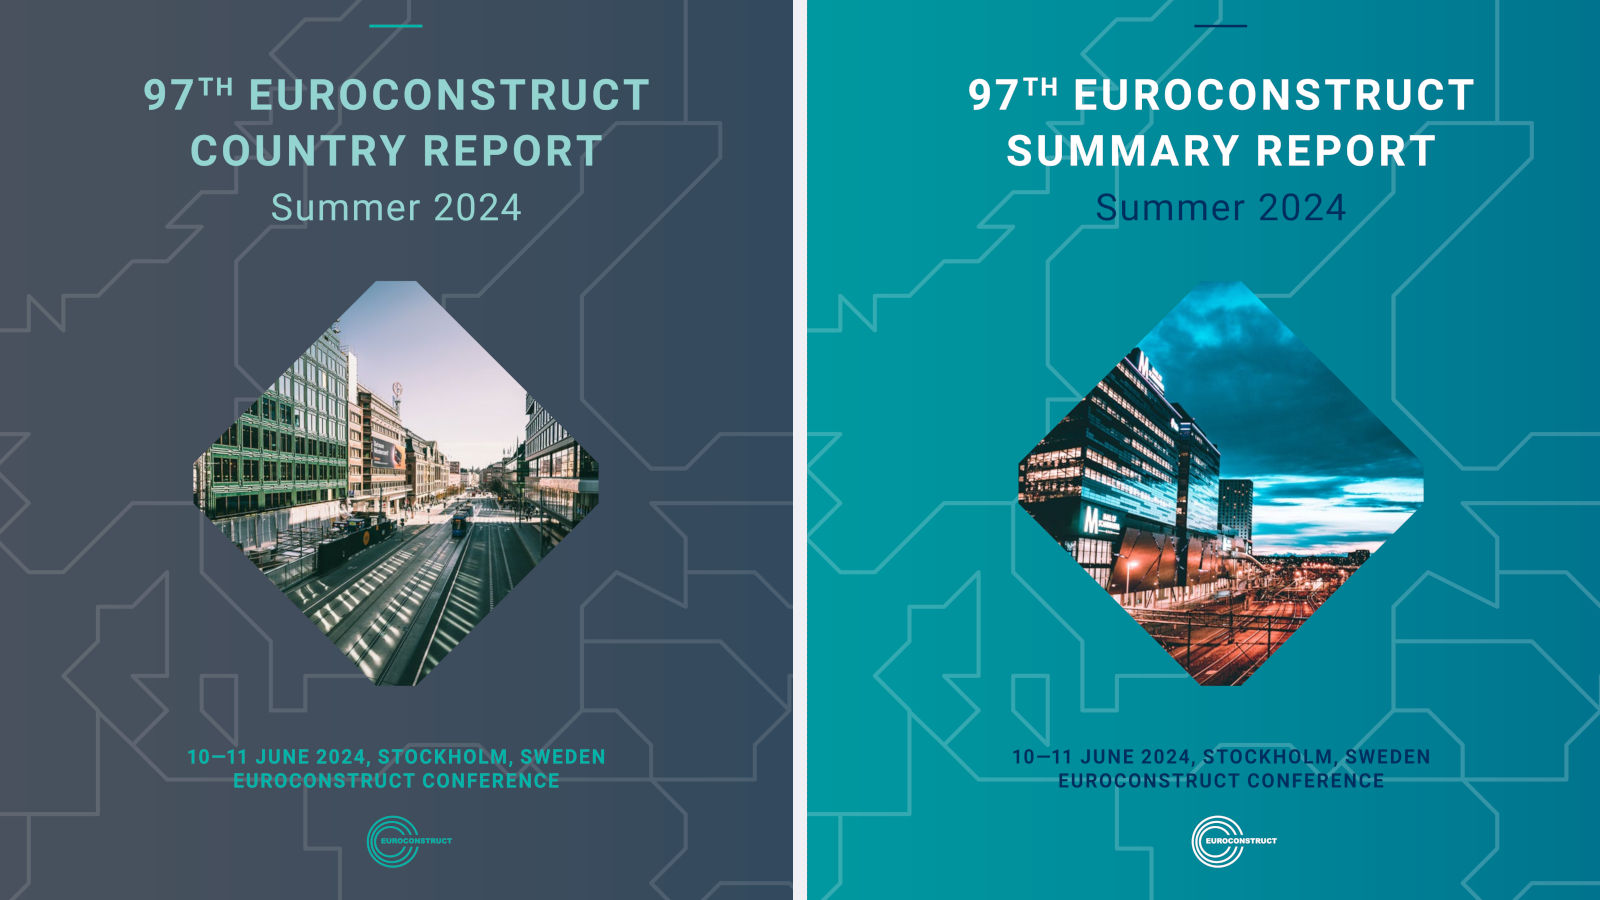
It was in 2014 when Euroconstruct started the centralized report making. Since then, we (Buildecon) have been responsible for the production. It is a great task for chart-fans like us and a privilege. In this post let us show you through some examples what is new in the latest editions.
But before that, a homage. At the Prague conference in 2013 Björn-Erik Oye, the man in charge of the then-upcoming conference in Oslo stepped up to me. “Janos, I would like you to prepare the reports for us” – he said. This was the first time in the history of Euroconstruct when the production was outsourced. It was a brave move from Björn-Erik and something I have been grateful to him ever since. From 2014 on, there were 22 forecast rounds. All were carried out in a centralized fashion.
After a couple of minor facelifts of the past, we decided to make some bigger changes for the Summer 2024 round. The underlying assumption was that most of you have your own way of handling the Euroconstruct (forecast) data. From these data, you can reproduce anything, based on your focus. So our task, in my opinion, is to provide something else. To highlight issues that you can digest easily and what you can remember when you start your inhouse data process. It may sound as an obvious goal, but it is not that obvious how to implement it.
Example 1: In country rankings, the order itself is more interesting than the chart in many cases. After all, the shape of the chart is always the same: it goes from big to small. So the chart is not telling enough. Therefore, we made two changes: 1) we gave more room for the text and 2) we reduced the number of ranking charts in the text by merging them together. This is how this one was born. It shows how the countries are foreseen to perform and the role of the submarkets within. It is a key visual to me.
ABOUT THE AUTHOR
János Gáspár
Buildecon
Janos Gaspar is the director of Buildecon, the Hungarian representative of EUROCONSTRUCT. And he has been coordinating the research work of the 8 EECFA countries outside EUROCONSTRUCT area since 2013.
For each submarket, we have a similar chart in the report. The only difference is that on those ones (for residential, non-residential, and civil engineering), the contribution of new and renovation works are shown.
Example 2: Two hard-to-chew rankings were replaced by this slope chart in the new report. This is a rather common visual and speaks for itself. The only issue is how much information to provide in a static environment.
Example 3: We have rearranged the summary tables. The new file contains all the data on one sheet. The advantage is that it is easier to search, it is more convenient for data processing and all our tables can be recreated by some filtering. I think it is pretty straightforward to use. The only issue is that we included some codes beside the indicators. This way the logic of the report is preserved, making searches easier.
Do you like the new summary tables? Please tell us.
The production process is designed to reveal and eliminate most possible errors in the data, in the charts and in the texts. Someone creates, another one checks (minimum one). This is the basic principal in every step of the way. The data checks are carried out by two members, independently from each other. Similarly, the summary tables are created by two members. And there are continuous cross-checking. Most charts are preset to lower the chance of making mistakes. We call them standard charts (green ones in the new reports). For the non-standard charts (purple ones) the basic principal applies. The members create them, the chart editor reformats them and we check them centrally. The texts are checked centrally two times. First, before uploading it to the editor and second, when the editor is done. On top of all this, there is a correction round, where the ready material is sent back to the writer for a final check. This is how we control quality.
The report in their current form would not exist without Yngve Abrahamsen (retired from ETH Zurich, KOF Swiss Economic Institute in 2023) who built up the structures for data handling and processing, without Josep Ramon Fontana (ITEC, Spain) who had created the first mini grid (chart) well before it became widespread, and without Ludwig Dorffmeister (IFO, Germany) who came up with the first standard graph set for the Summary Report. Respect to them and to all the past, current and future members of this special forecasting cooperation. And extra thanks to Zsolt Ligetfalvi (design), Richard Timak (report editor), Robert Kovacs (graph editor) and Eszter Falucskai (Mrs. Boss) for their outstanding dedication.
Should you like to obtain any of our recent reports, please contact your local Euroconstruct partner.
ABOUT THE AUTHOR
János Gáspár
Buildecon
Janos Gaspar is the director of Buildecon, the Hungarian representative of EUROCONSTRUCT. And he has been coordinating the research work of the 8 EECFA countries outside EUROCONSTRUCT area since 2013.
